
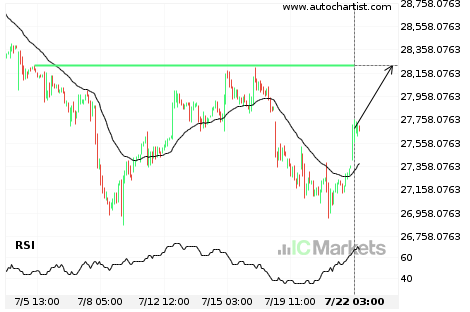
A final push expected on Hong Kong 50 Index
Hong Kong 50 Index is heading towards a price line of 28220.0000 and could reach this point within the next 2 days. It has tested this line numerous times in the past, and this time could be no different from the past, ending in a rebound instead of a breakout. If the breakout doesn’t happen, […]
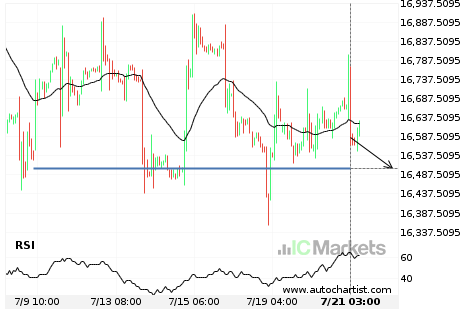
Either a rebound or a breakout imminent on FTSE China A50 Index
FTSE China A50 Index is heading towards a line of 16505.0898. If this movement continues, we expect the price of FTSE China A50 Index to test 16505.0898 within the next 2 days. But don’t be so quick to trade, it has tested this line numerous times in the past, so this movement could be short-lived […]
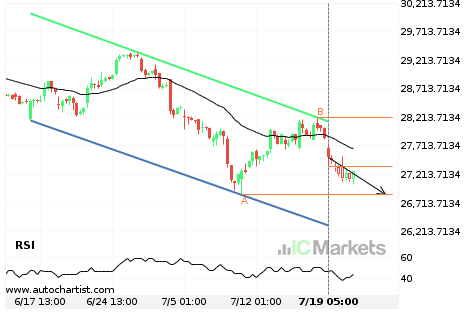
Either a rebound or a breakout imminent on Hong Kong 50 Index
Hong Kong 50 Index is heading towards the support line of a Channel Down. If this movement continues, we expect the price of Hong Kong 50 Index to test 26855.0000 within the next 3 days. But don’t be so quick to trade, it has tested this line numerous times in the past, so this movement […]
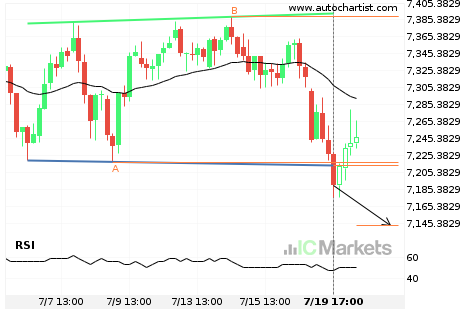
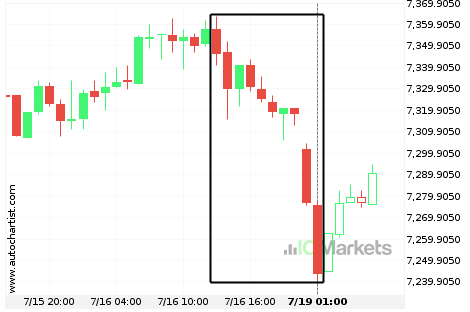
Big movement expected on Australia 200 Index
Australia 200 Index has broken through a support line of a Rectangle and suggests a possible movement to 7142.9722 within the next 3 days. It has tested this line in the past, so one should probably wait for a confirmation of this breakout before placing a trade. If the breakout doesn’t confirm, we could see […]
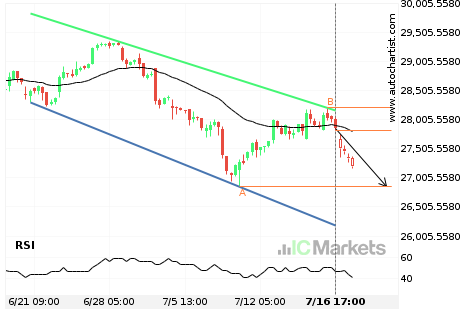
Either a rebound or a breakout imminent on Hong Kong 50 Index
Hong Kong 50 Index is heading towards the support line of a Channel Down. If this movement continues, we expect the price of Hong Kong 50 Index to test 26855.0000 within the next 22 hours. But don’t be so quick to trade, it has tested this line numerous times in the past, so this movement […]
Where is Australia 200 Index moving to?
A movement of 1.39% over 3 days on Australia 200 Index doesn’t go unnoticed. You may start considering where it’s heading next, a continuation of the current downward trend, or a reversal in the previous direction.

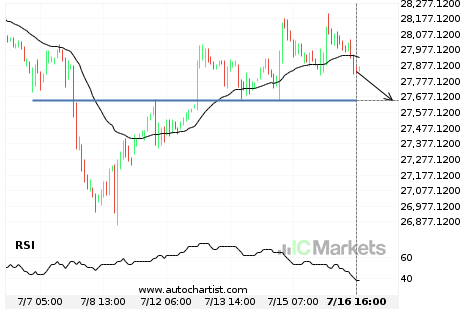
Hong Kong 50 Index approaching important 27655.5000 price line
Hong Kong 50 Index is approaching the support line of a Support. It has touched this line numerous times in the last 10 days. If it tests this line again, it should do so in the next 2 days.
Hong Kong 50 Index approaching important 27655.5000 price line
Hong Kong 50 Index is approaching the support line of a Support. It has touched this line numerous times in the last 10 days. If it tests this line again, it should do so in the next 2 days.